National Hurricane Center
Atlantic 7-Day Outlook
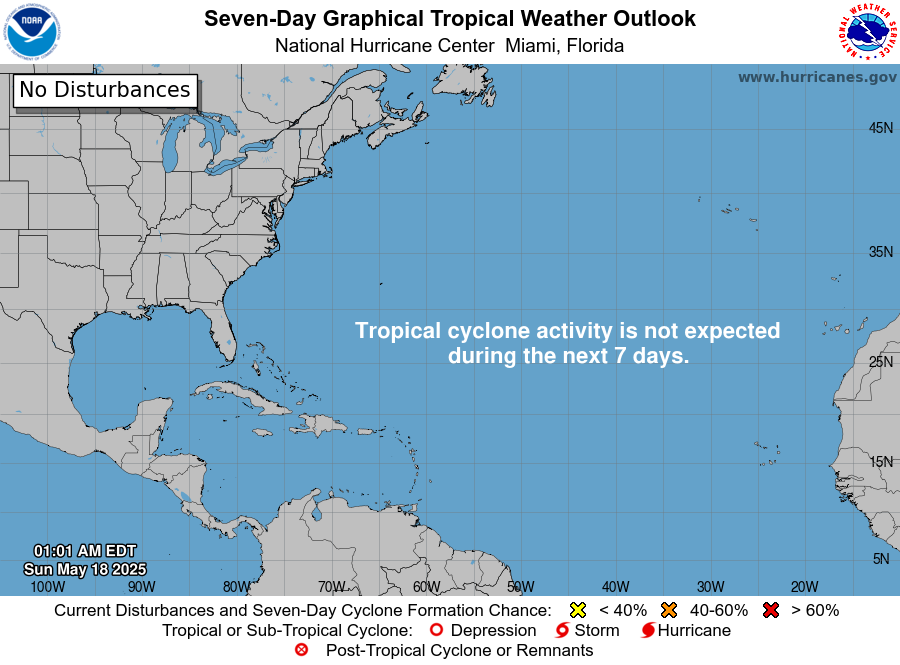 Outlook image unavailable. Open the NHC outlook for current guidance ↗
NHC graphic updates at the provider. Check the source page for its issue time and full discussion.
 WeatherTogetherYour home. Your coast.Local Help
Atlantic hurricane season
Follow developing systems across the Atlantic, Caribbean, and Gulf with official guidance and live weather imagery.
For watches, warnings, and decisions, use the latest NHC advisory and NWS Mobile local guidance. Model tracks are possible scenarios, and hazards can extend outside a forecast cone.
National Hurricane Center
Outlook image unavailable. Open the NHC outlook for current guidance ↗NHC graphic updates at the provider. Check the source page for its issue time and full discussion.
Selected Atlantic system
Connecting to the National Hurricane Center feed…
Loading the latest advisory…
NWS Mobile / Pensacola
Alerts below apply to the Pensacola city-center point. Open the NWS threat maps for the wider coast and potential impacts.
A missing point alert does not mean a hazard is absent. NWS Hurricane Threats and Impacts maps appear when relevant watches or warnings are in effect.
Explore Gulf radar on Forecast & Maps ↗
Coastal and inland water
Checking NHC for a storm surge forecast graphic…
Check NHC surge products ↗Forecast coastal flooding guidance, not an observed water level. The separate NHC inundation map may be available for qualifying threats.Observed · NOAA CO-OPS
NOAA GOES-19

Satellite image unavailable. Open the NOAA source above for current imagery.

Lightning image unavailable. Open the NOAA source above for current imagery.

Infrared image unavailable. Open the NOAA source above for current imagery.

Atlantic image unavailable. Open the NOAA source above for current imagery.
NOAA GeoColor uses visible imagery by day and infrared at night. Band 13 shows clean longwave infrared imagery. The Gulf GeoColor loop loads when scrolled into view; lightning and infrared loops start on request. Check the NOAA source pages for image times.
Sea surface temperature map is unavailable.
Water temperature patterns across the Gulf. Check the Xweather color legend ↗ for the scale.
Wave height map is unavailable.
Offshore wave guidance is not a beach safety forecast. Check the Xweather color legend ↗ for the scale.
Ocean currents map is unavailable.
A regional view of modeled Gulf currents. Check the Xweather color legend ↗ for the scale.
Images are cached by WeatherTogether. The time shown is when they were fetched, not a verified model valid time. Powered by Vaisala Xweather.
Supplemental forecast guidance
Explore possible tracks and weather patterns. Model output can disagree or change between runs; use NHC advisories for the official forecast.
Weathernerds model viewers open at the source. The Google link preserves your selected settings and forecast time.
More context
Tropical Tidbits does not permit persistent embedding of its updating imagery without special permission, so its live tools open at the source.